Using Pix with Unreal 5.5
This page shows how to get the Pix GPU Capture program working with Unreal 5.5.1 so you can debug and profile materials and shaders.
Approach
We will be running PIX-2412.12 on Windows, and using the Epic Lyra Starter Game as an example.
Windows Setup
Install Pix from https://devblogs.microsoft.com/pix/download/
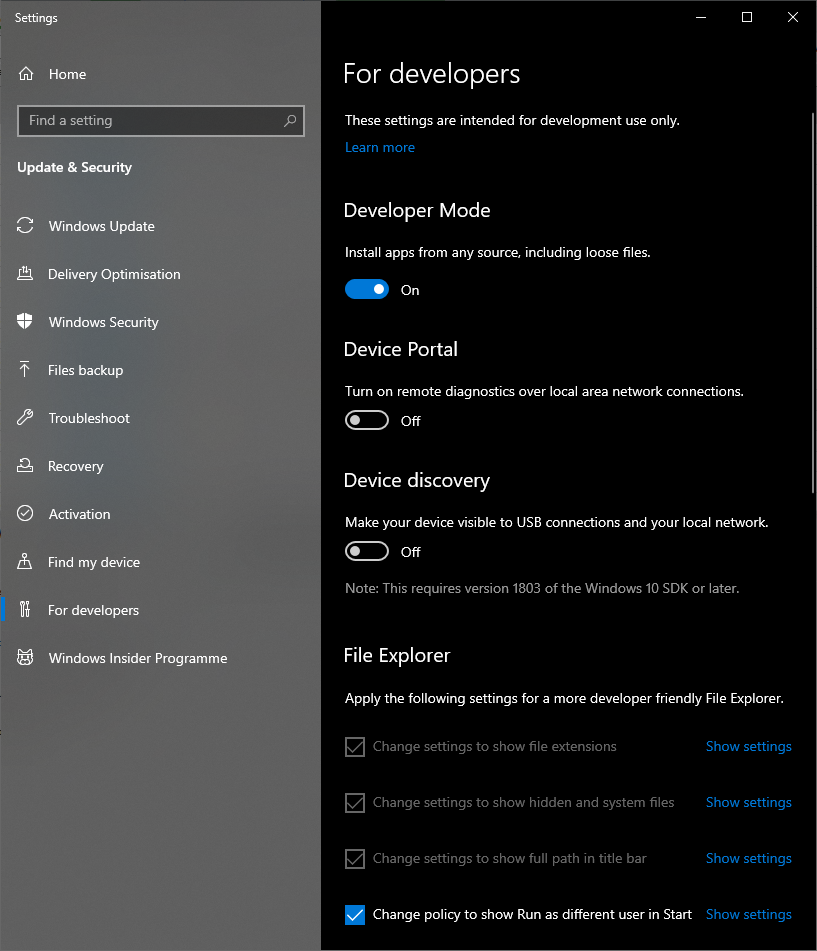
For Pix to work Developer Mode needs to be turned on in Window System settings:
If this message appears when you start analysing a frame:
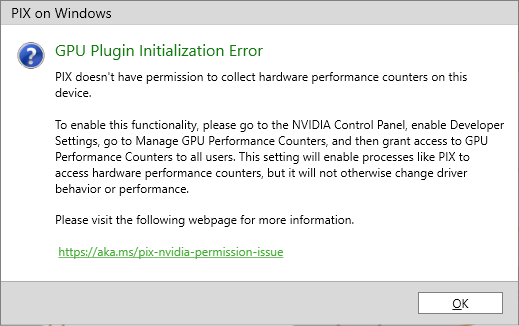
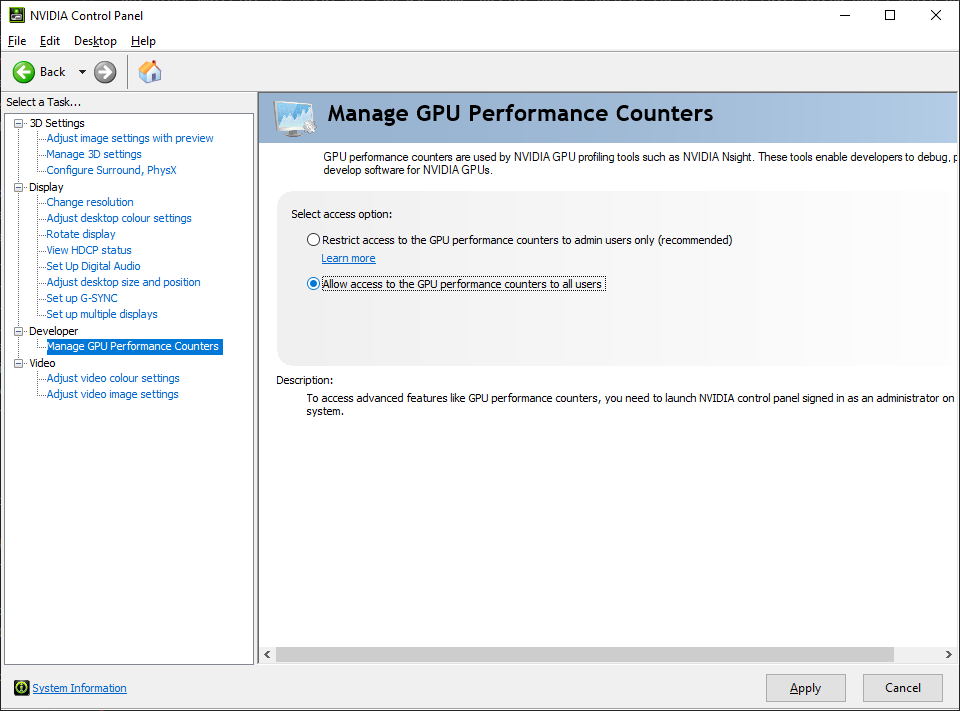
Use Nvidia Control Panel to enabled Developer Settings and grant access to GPU counters:
This might crash Unreal and other apps when you apply these settings.
Project Setup
Edit Config\DefaultEngine.ini add this (this will cause the editor to recompile all shaders):
[ShaderCompiler]
r.Shaders.Symbols=1
r.Shaders.ExtraData=1
r.Shaders.GenerateSymbols=1
r.Shaders.WriteSymbols=1
r.Shaders.SkipCompression=1
r.ShaderDevelopmentMode=1
If debugging shaders use:
r.Shaders.Optimize=0
If profiling shaders use:
r.Shaders.Optimize=1
Open the project.
Make sure the plugin "PIX On Windows GPU Capture Plugin" is enabled.
Pix uses symbols from PDB files, by default it looks for them in the same directory as the game executable.
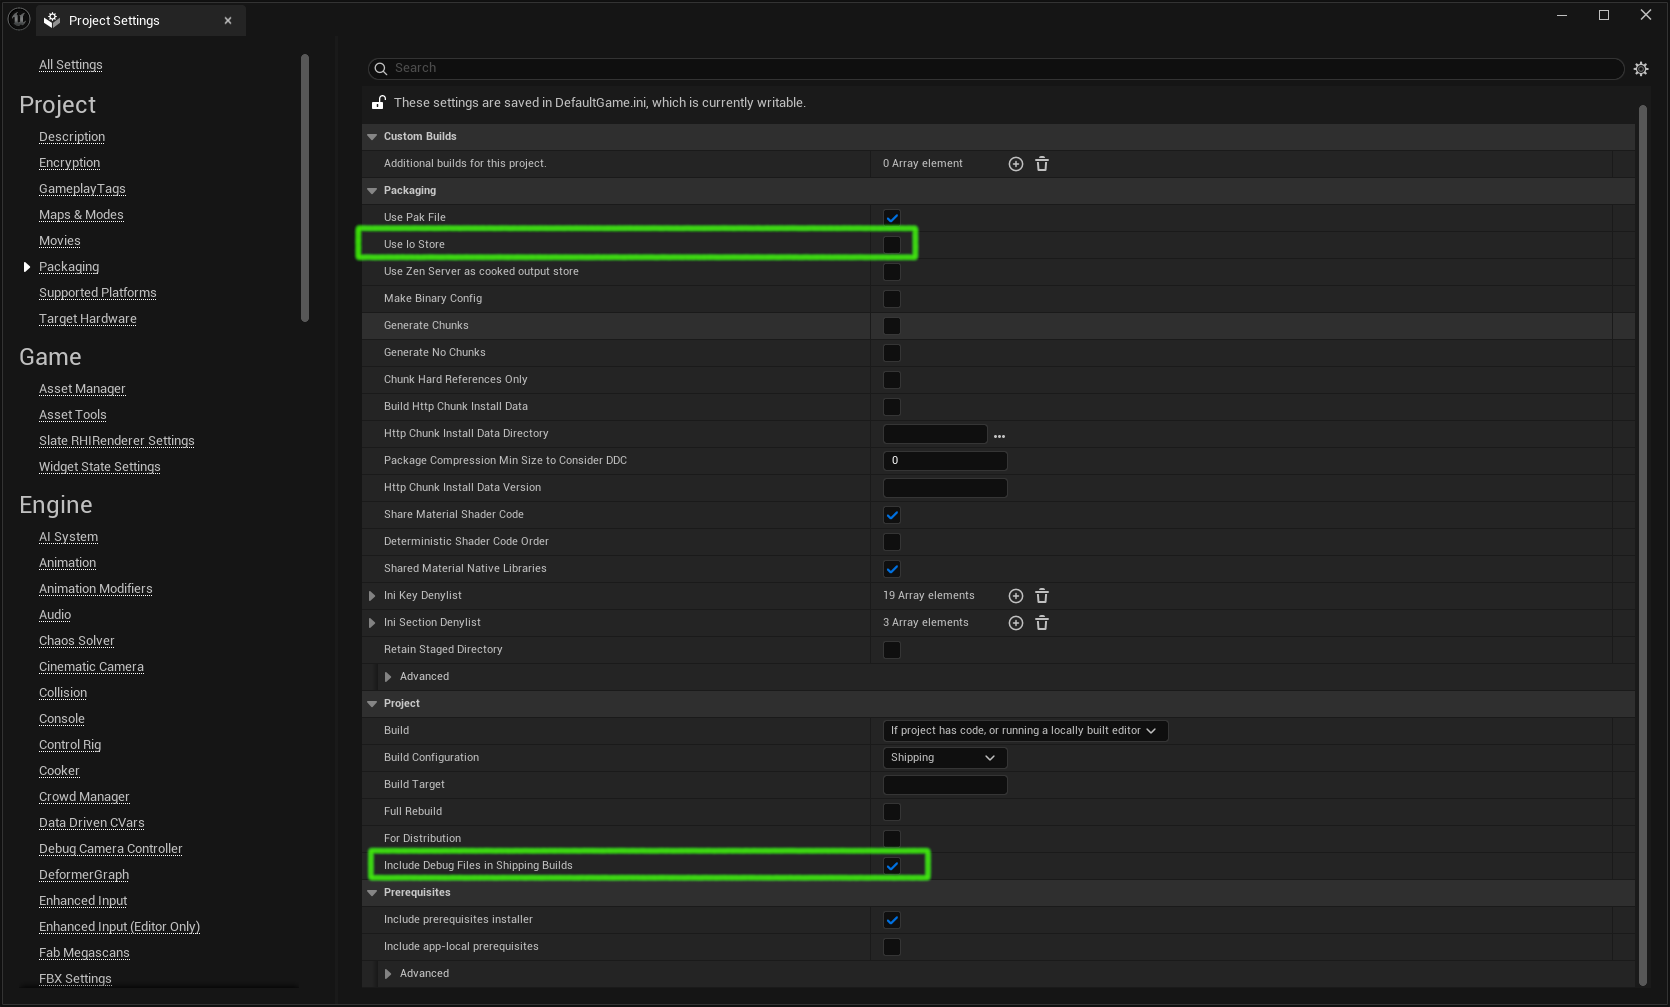
In Project Settings | Project | Packaging:
- set "Use Io Store" to false
If you want to run Pix with Shipping builds:
In Project Settings | Project | Packaging:
- set "Include Debug Files in Shipping Builds" to true
Packaging
Package the project with these settings:
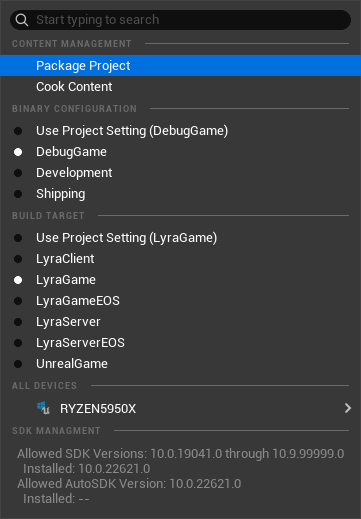
Package into a subdirectory called "Packaged" which will be used in the example paths below.
Running Pix
Run Pix and configure the "Select Target Process" window with the path to the executable and command line options like this:
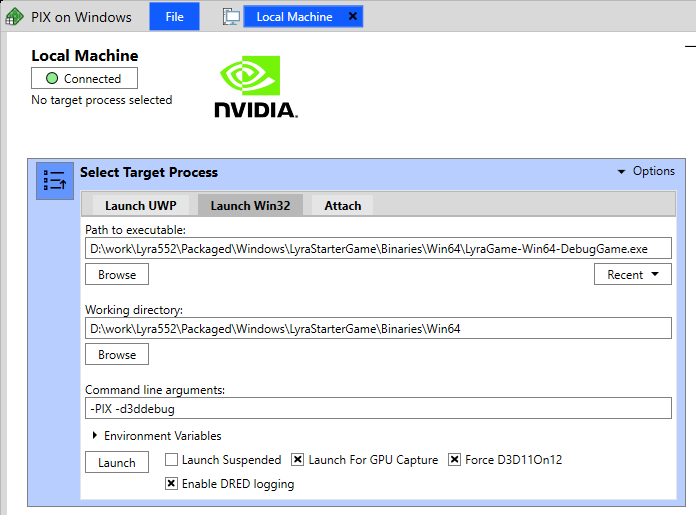
Press the "Launch" button.
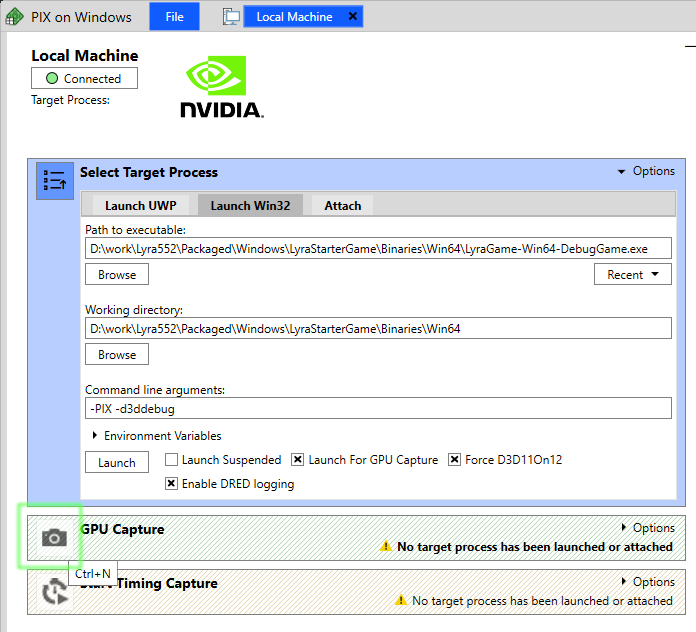
The game should start. Alt-tab back to Pix and press the "GPU Capture" button or press Ctrl-N.
After a few seconds a thumbnail of the captured frame appears. Click the thumbnail to open the analysis window:
In the center bottom area click on the "Click here to start analysis and collect timing data". If you are prompted to close the game you can do so.
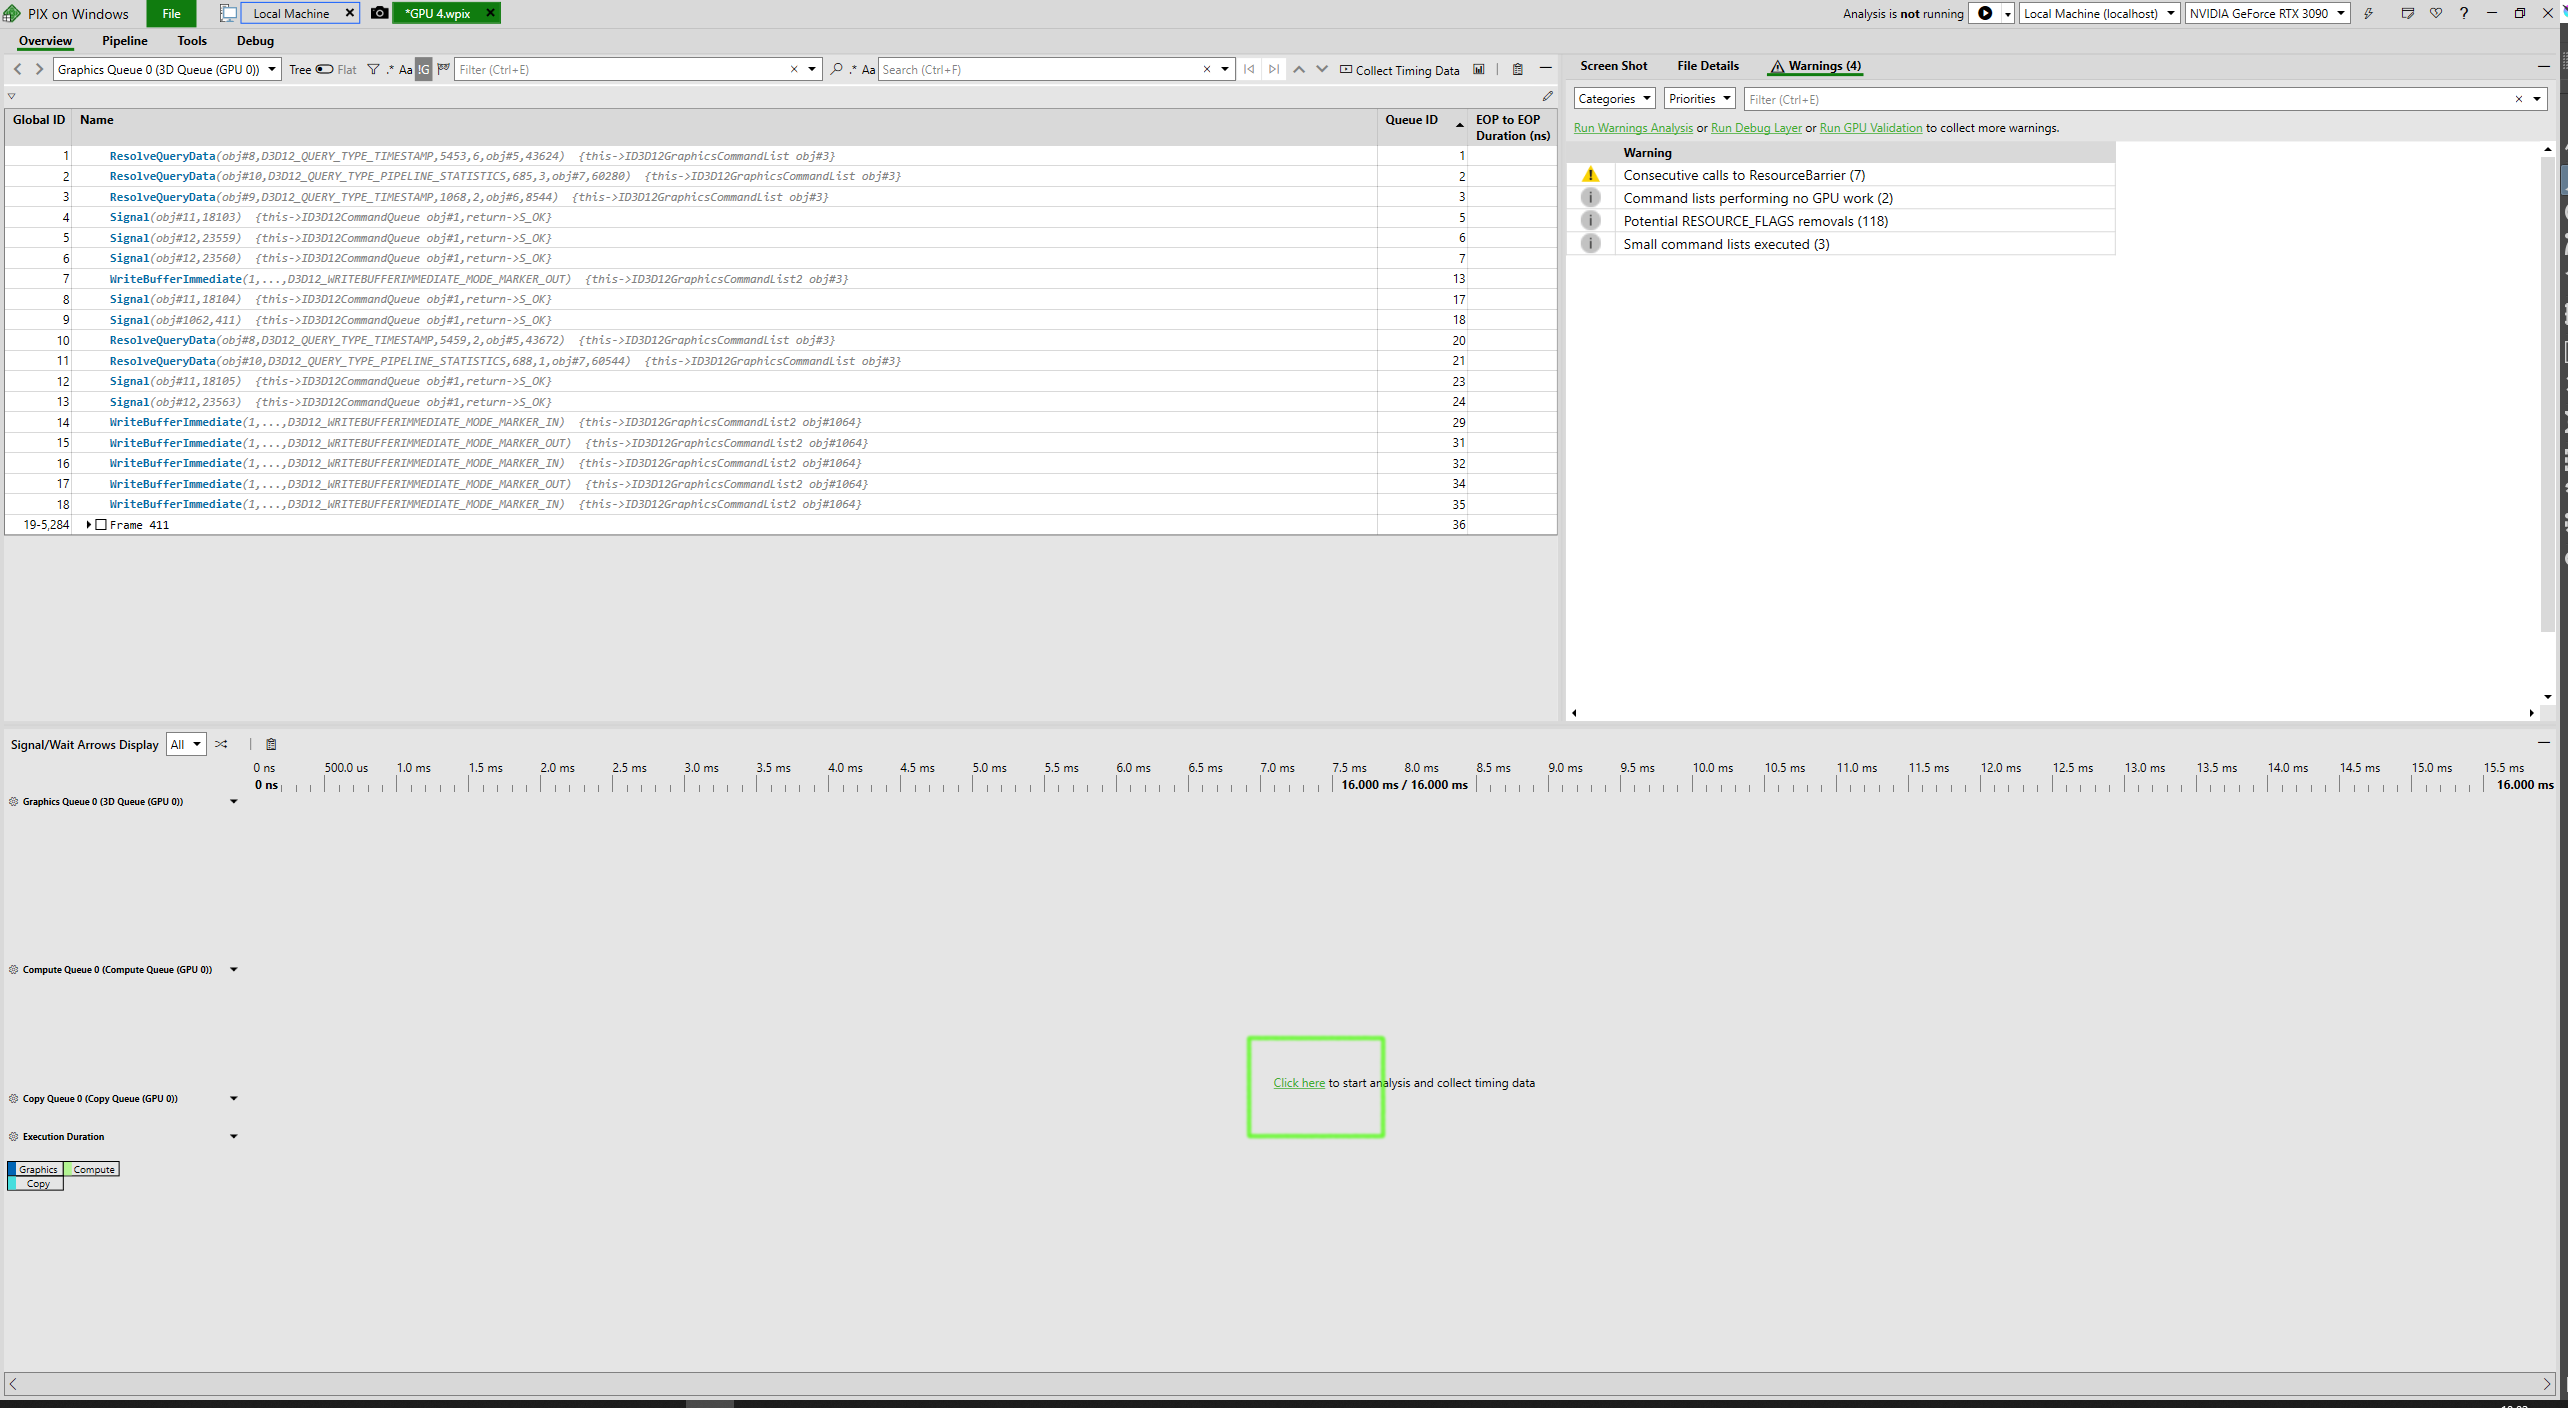
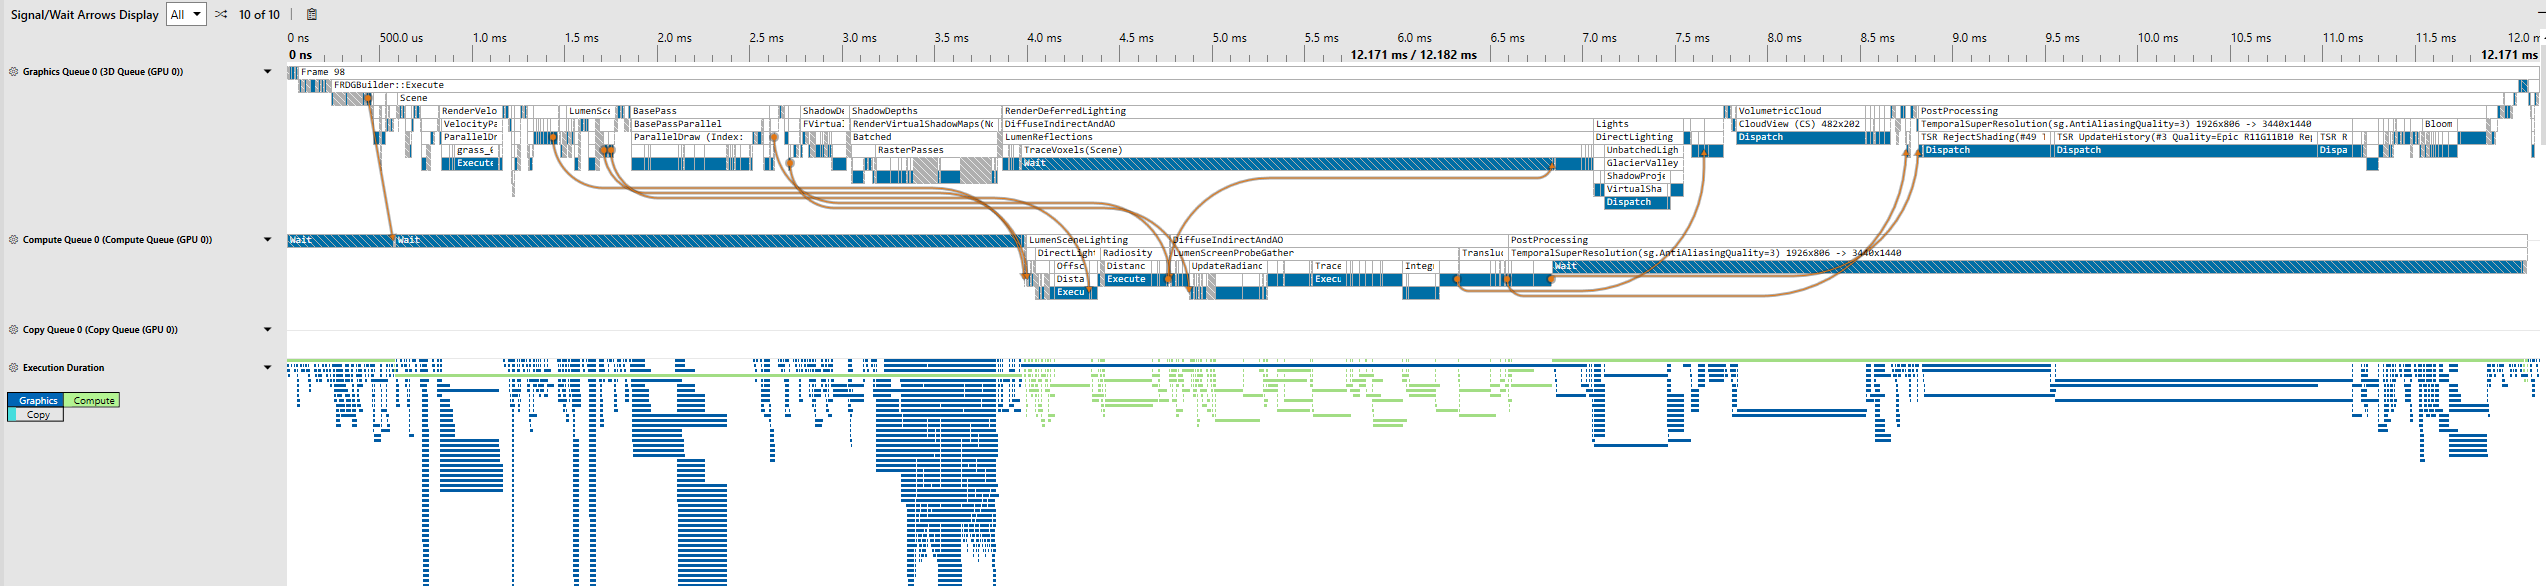
After 5-10 seconds the lower part of the window will fill with events occuring in the frame:

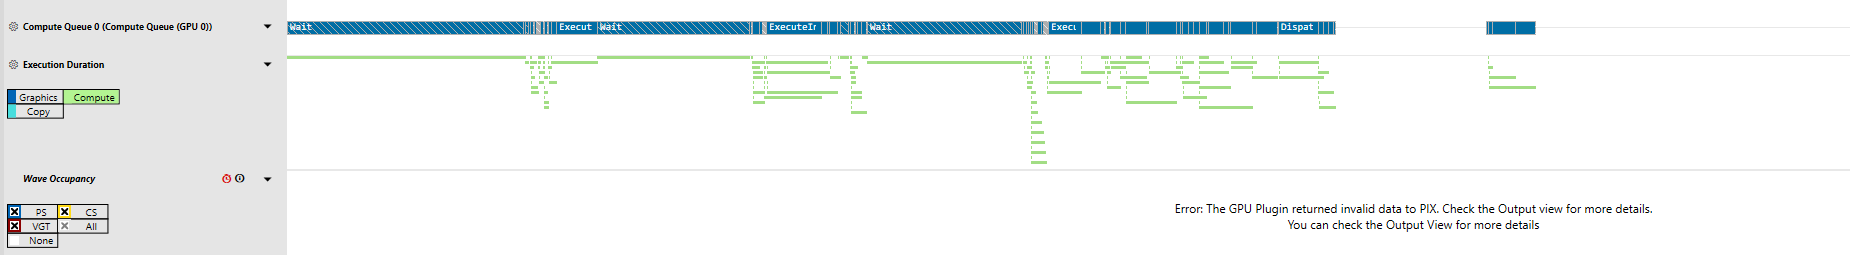
If instead you see this, with only one line and no names other than "wait" and "execute" you might be running a shipping packaged build with no symbols - to fix this try running a debug packaged build:
If you see nothing in the "Graphics Queue 0" part of the screen:
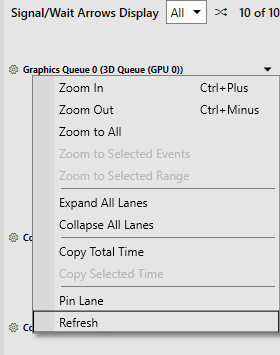
Right-click the "Graphics Queue 0" and select "Refresh" from the menu:
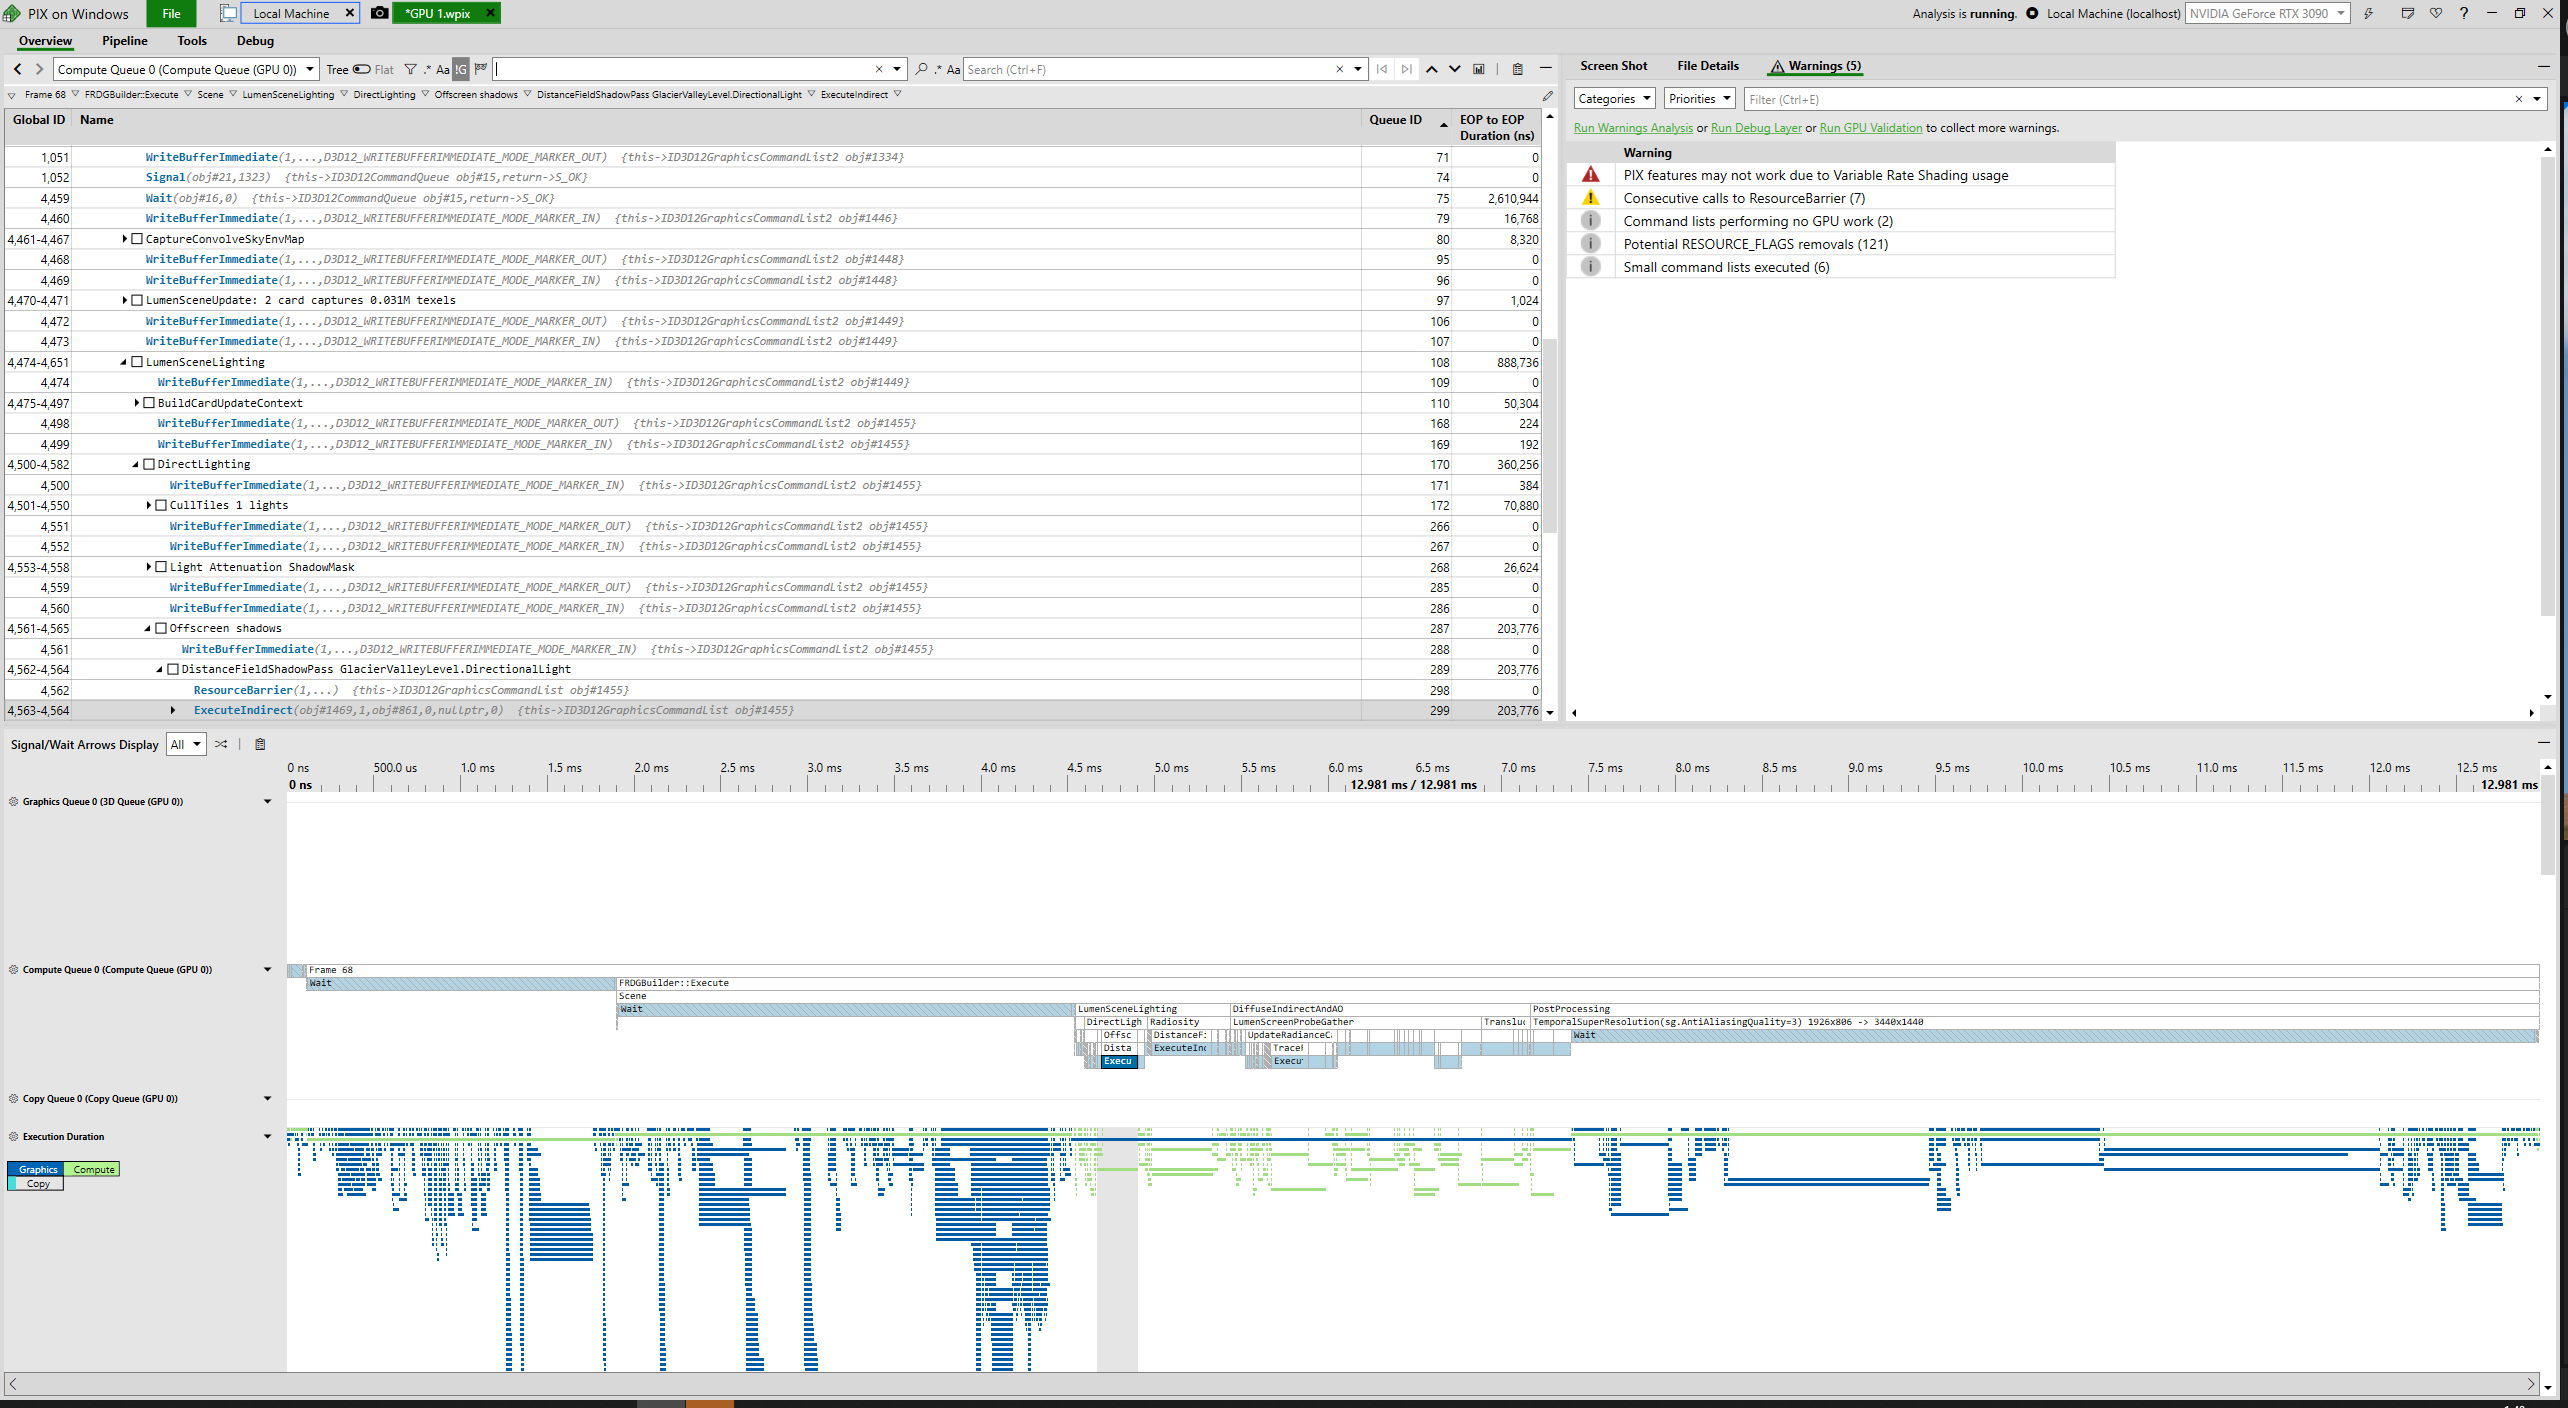
You should eventually see the populated graphic queue:
Using Pix
Once you have a frame captured you can do things such as:
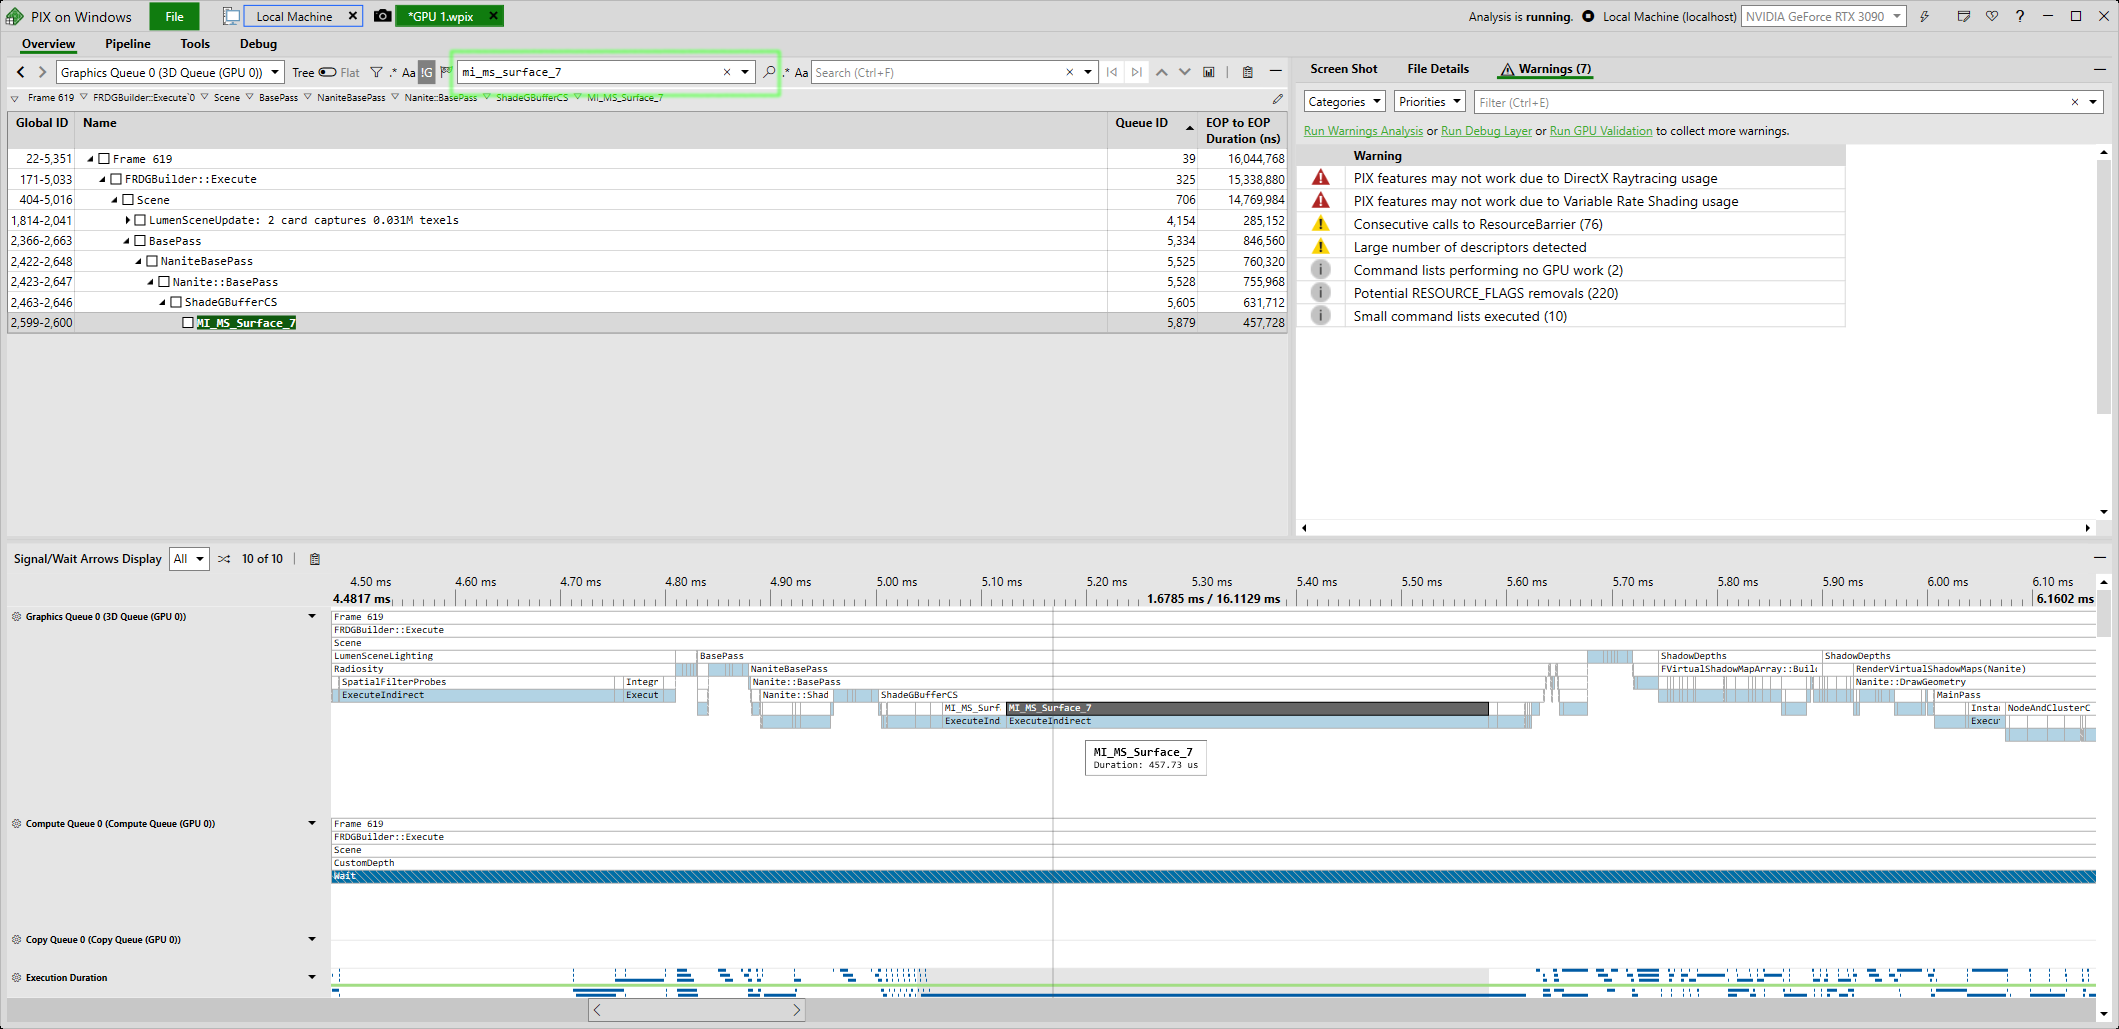
- put a material name into the search bar at the top of the screen and look at the performance of that shader:
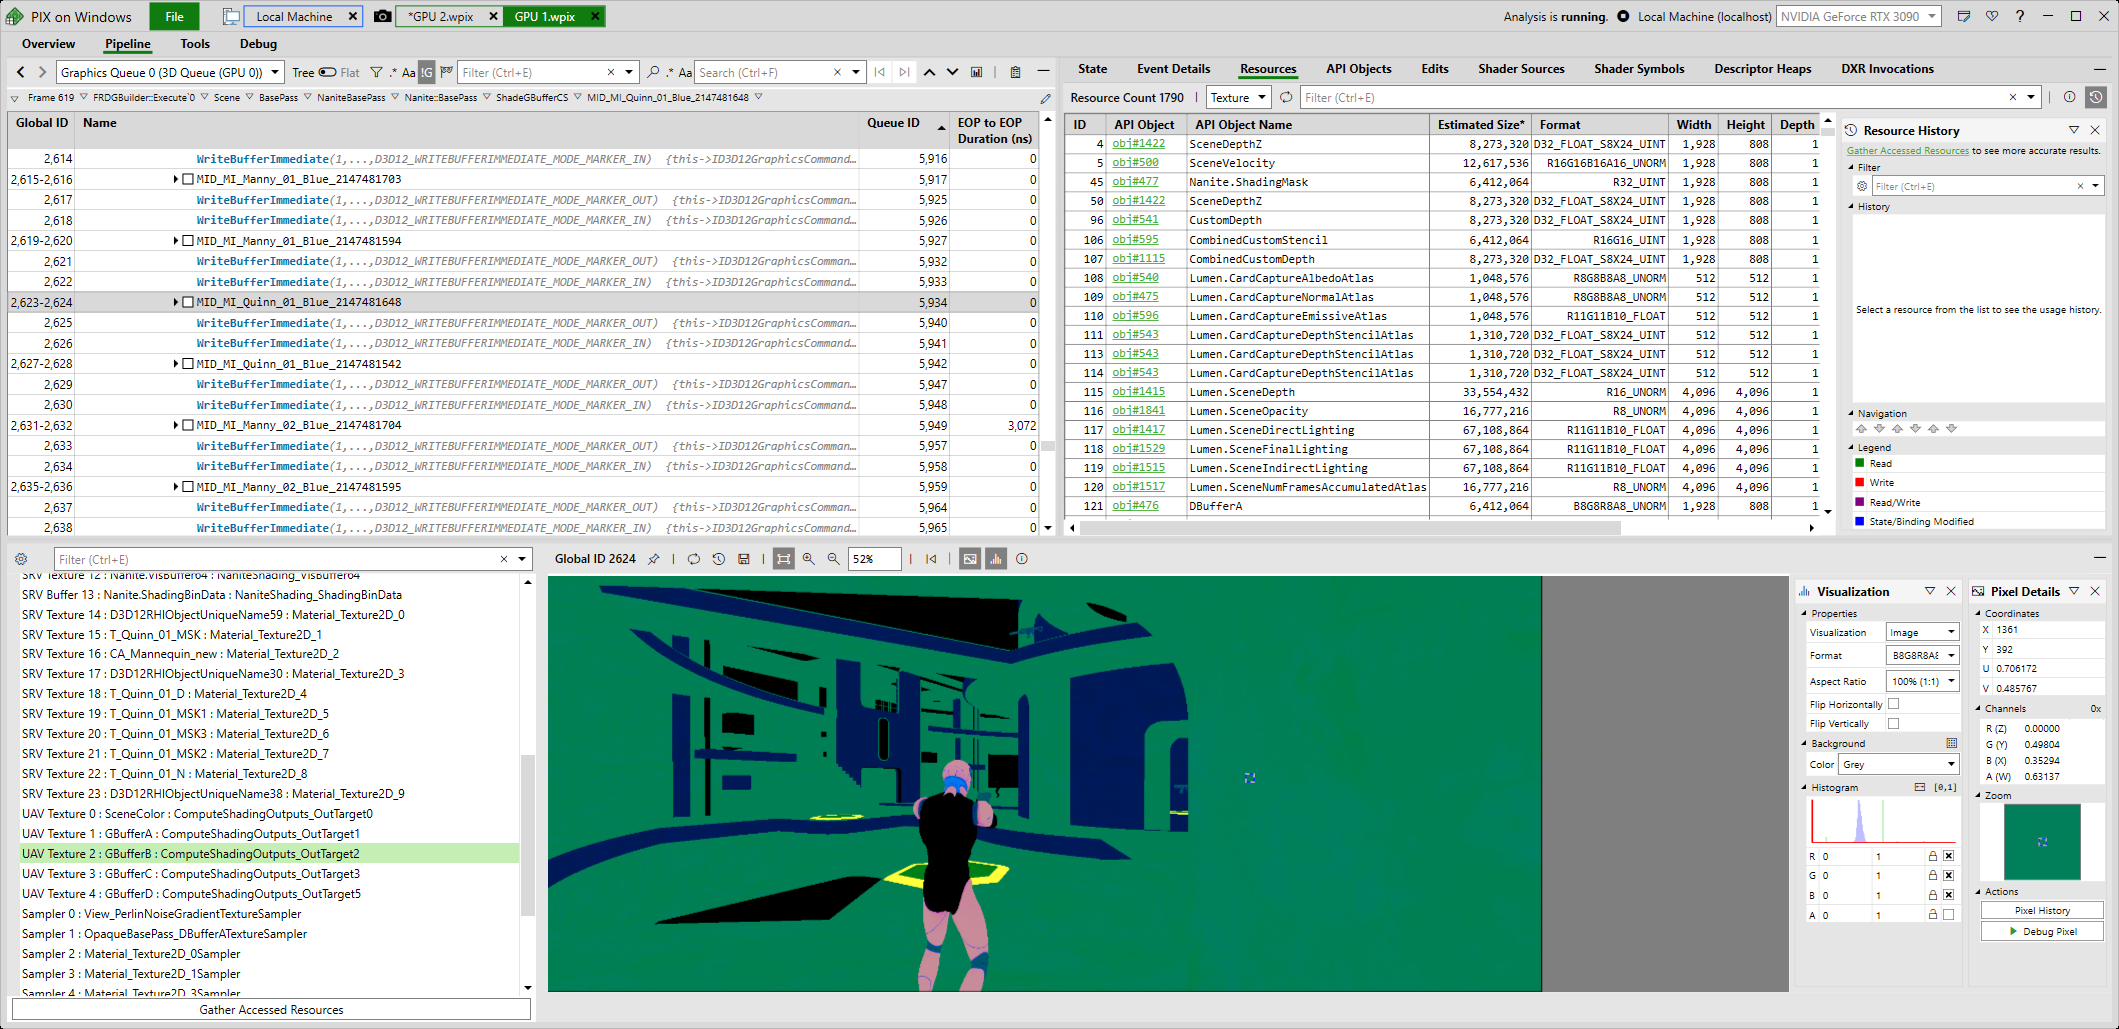
- click on the "Pipeline" tab, then select event in the top left window, then select a buffer in the bottom left window and see the contents of that buffer. You can also click on the buffer image to select a pixel and see how it was created:
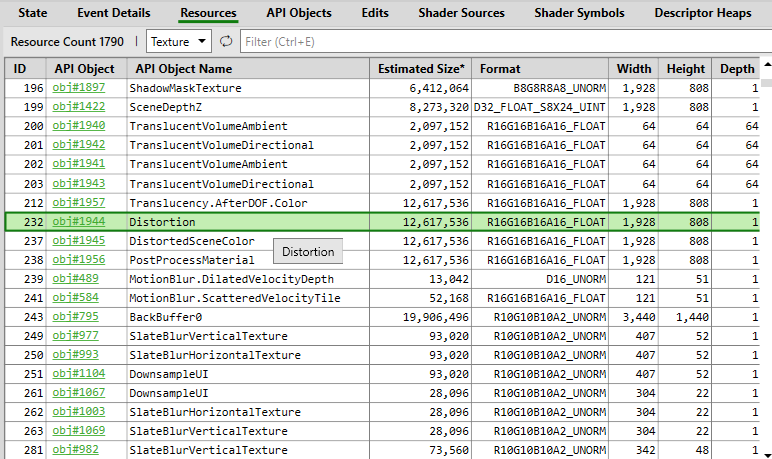
- look at texture formats and memory uses in the "Resources" tab in the top right window:
Capturing from the Game
This is another way of capturing Pix data.
Package a Development build
From the command line run it with these options:
Game.exe -attachPIX -d3ddebug
open the console with ~ and run the command
pix.GpuCaptureFrame
This will capture frame data to a file [PackageDir]\Windows[ProjectName]\Saved\PixCaptures
References
Feedback
Please leave any feedback about this article here